Market Report · Southern OntarioJuly 2026 Southern Ontario Real Estate Market Report: What's Really Happening Across the GTA And Surroundings📅 Published August 7, 2026📊 Based on July

Dated: August 7 2026
Views: 84
Market Report · Southern Ontario
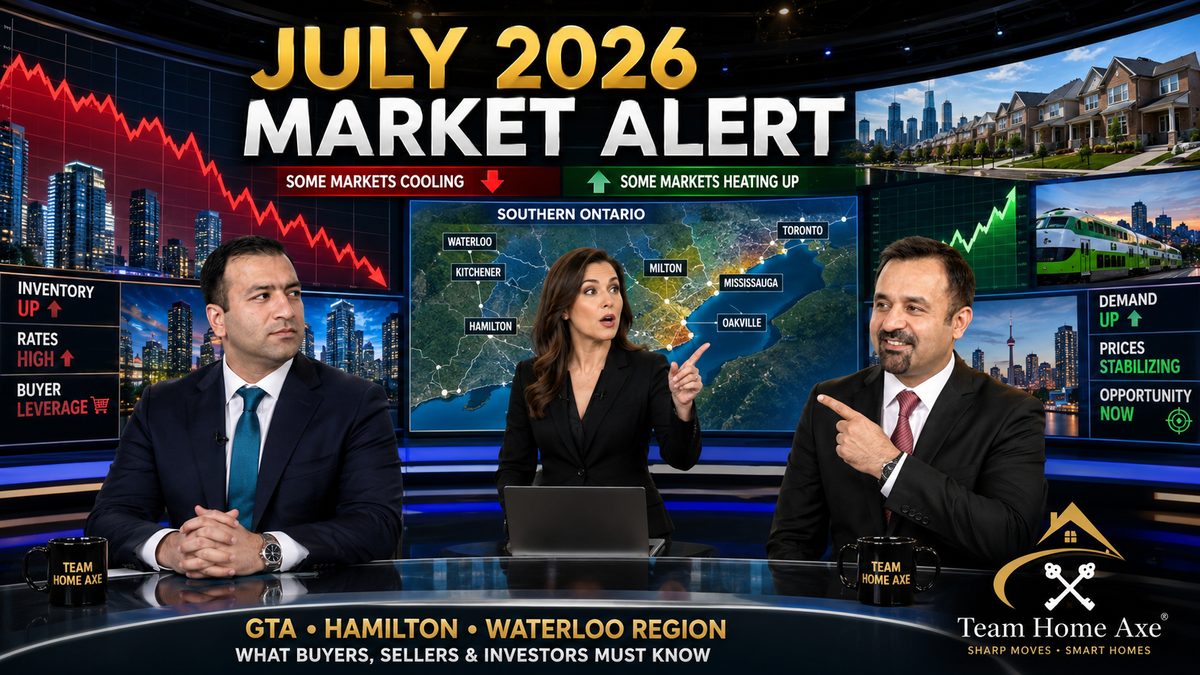
The July 2026 Southern Ontario home sales report tells a more nuanced story than either "the market is crashing" or "the market has recovered." Supply tightened sharply, prices stayed down year-over-year, and the picture varies enormously depending on which municipality — and which housing type — you're looking at.
Below, Team Home Axe breaks down what actually happened across the GTA, Hamilton-Burlington and Waterloo Region last month, and what it means if you're buying, selling, or investing this fall.
Watch: Team Home Axe's take on the July 2026 Southern Ontario market
The GTA resale market tightened materially in July because new listings fell much faster than sales. TRREB recorded 5,995 GTA sales, down 0.9% from July 2025, while new listings declined 17.8% to 14,484. Active listings fell 12.1% to 26,098. The average GTA selling price was $1,003,956, down 4.5% year-over-year, while the MLS Home Price Index composite benchmark declined 4.6%.
| GTA Indicator | July 2026 | Annual Change |
|---|---|---|
| Home sales | 5,995 | -0.9% |
| New listings | 14,484 | -17.8% |
| Active listings | 26,098 | -12.1% |
| Average sale price | $1,003,956 | -4.5% |
| MLS HPI composite benchmark | — | -4.6% |
| Months of inventory | 4.6 | — |
| Average days on market | 32 | — |
| Sales-to-new-listings ratio | 37.1% | — |
On a seasonally adjusted basis, sales actually increased from June while new listings decreased — the clearest evidence that the July update is about tightening supply, not yet about broad-based price growth. TRREB has said that if the trend continues, average selling prices could begin to level off during the second half of 2026.
Broadly, the GTA remains balanced to buyer-leaning — but that balance is shifting fast.
Buyers still benefit from prices below July 2025 levels, longer marketing periods, and negotiating room on stale or overpriced listings. But competition is increasing for realistically priced homes, especially in lower-inventory municipalities and family-oriented housing segments.
TRREB's July statistics show substantial differences between municipalities. Average prices should be interpreted cautiously, since monthly transaction mix can materially affect the result — a municipality with more luxury sales in one month may show a higher average without any broad price appreciation.
| Region | July Sales | Avg. Price | New Listings | Active Listings | Months of Inventory |
|---|---|---|---|---|---|
| City of Toronto | 2,242 | $1,010,836 | 4,980 | 9,310 | 4.2 |
| Peel Region | 1,053 | $910,007 | 2,875 | 5,055 | 5.0 |
| York Region | 1,063 | $1,146,307 | 2,764 | 5,179 | 5.0 |
| Durham Region | 725 | $834,312 | 1,719 | 2,579 | 3.4 |
| Halton Region | 682 | $1,151,595 | 1,503 | 2,659 | 4.2 |
| All TRREB Areas | 5,995 | $1,003,956 | 14,484 | 26,098 | 4.6 |
Toronto recorded 2,242 sales at an average price of $1,010,836, with 4,980 new listings, 9,310 active listings and roughly 4.2 months of inventory. The citywide average masks a more balanced picture underneath: Toronto Central remained the most expensive submarket, while Toronto East and Toronto West offered a broader mix of lower-priced detached, semi-detached, townhouse and condo opportunities.
For buyers, the strongest search strategy isn't asking which neighbourhood is "best" — it's comparing:
Toronto's 4.2 months of inventory sat below the GTA average — properly priced homes here could attract more attention than listings in higher-supply pockets.
Peel recorded 1,053 sales at an average price of $910,007. Brampton and Mississauga each posted 498 sales at an average of $885,702 in the July TRREB breakdown. The Mississauga market remained highly segmented — condos, townhouses, older detached homes and newer low-rise properties each carry different costs and resale dynamics. Brampton stayed more focused on family-oriented low-rise housing, where lot size, commuting costs, property taxes and aging-stock condition matter most.
Peel's five months of inventory was noticeably higher than Durham's 3.4 — buyers generally had more selection and negotiating room here, though turnkey homes still moved quickly.
York Region recorded 1,063 sales at an average price of $1,146,307, with 2,764 new listings, 5,179 active listings and five months of inventory.
| Municipality | July Sales | Avg. Price | Months of Inventory |
|---|---|---|---|
| Markham | 554 | $1,131,324 | 4.9 |
| Vaughan | 272 | $1,144,631 | 4.9 |
| Aurora | 62 | $1,301,811 | 4.9 |
| Newmarket | 47 | $1,042,536 | 5.3 |
| King | 61 | $2,028,099 | 6.2 |
King City should be viewed separately from the broader York market — its values run substantially higher on relatively small monthly volumes, which may mean more negotiating room in luxury and estate properties. Aurora and Newmarket may suit buyers wanting larger homes and established communities at prices below King and parts of Vaughan, while Markham and Vaughan remain stronger picks for urban amenities, transit access and condo availability.
Durham recorded 725 sales at an average price of $834,312, with 1,719 new listings, 2,579 active listings and just 3.4 months of inventory — the lowest regional figure in the TRREB table.
| Municipality | July Sales | Avg. Price |
|---|---|---|
| Ajax | 111 | $907,336 |
| Pickering | 182 | $894,776 |
| Whitby | 272 | $860,000 |
| Oshawa | 177 | $753,919 |
| Clarington | 82 | $966,817 |
The tighter inventory makes Durham one of the more competitive GTA areas for well-priced family homes. Pickering and Ajax continued to command premiums over Oshawa thanks to Toronto proximity and transit links. Oshawa and parts of Clarington may offer lower entry prices — but a low months-of-inventory figure doesn't mean every property is competitive; condition and pricing remain decisive.
Halton recorded 682 sales at an average price of $1,151,595, with 1,503 new listings, 2,659 active listings and 4.2 months of inventory.
| Municipality | July Sales | Avg. Price |
|---|---|---|
| Oakville | 147 | $1,412,619 |
| Burlington | 248 | $1,131,324 |
| Milton | 221 | $1,050,887 |
| Halton Hills | 66 | $968,388 |
Oakville remained the most expensive major Halton market — buyers seeking value may find opportunities in older homes, properties needing renovation, or listings that have accumulated market time. In Milton, newer townhomes and detached homes continued to attract buyers seeking space at a lower price than Oakville, though carrying costs and future resale competition among similar new developments are worth stress-testing.
The latest verified Cornerstone data for Hamilton-Burlington is June 2026, published July 6 — it should not be read as July data. A separate verified July Brantford breakdown was not available at publication.
Burlington's June release showed 240 sales, a $1,171,342 average price, 3.6 months of supply and a 0.9% year-over-year price increase — sales up 14.8% while new listings fell 14.4%, one of the stronger performances in the broader Hamilton-Burlington area. Across Hamilton-Burlington-Haldimand-Niagara North overall, sales rose 5.4% year-over-year to 899, while the average price declined 4.5% to $857,297.
| Market | Sales | Avg. Price | New Listings | Months of Supply |
|---|---|---|---|---|
| Hamilton-Burlington-Haldimand-Niagara North | 899 | $857,297 | 1,916 | 4.8 |
| Hamilton | 551 | $746,245 | 1,211 | 5.0 |
| Burlington | 240 | $1,171,342 | 416 | 3.6 |
| Haldimand | 57 | $620,632 | 148 | 6.9 |
| Niagara North | 65 | $781,338 | 168 | Not stated |
June showed a divided market: Hamilton had more supply and lower prices, while Burlington posted stronger sales, tighter inventory and modest price growth. Within Hamilton itself, buyers should distinguish between Hamilton Mountain, the lower city, Ancaster, Waterdown and Stoney Creek — detached homes in established family neighbourhoods may perform better than condos carrying high monthly fees or homes needing significant renovation.
Cornerstone's latest verified Waterloo Region release, published July 6, also covers June 2026 — the source page had not yet posted July regional statistics at the time of writing.
Region-wide sales were 662 in June, down 2.9% year-over-year, while the average price declined 6.4% to $729,650. New listings fell 7.6% to 1,407, months of supply decreased to 4.1, and average days on market held steady at 27.
| City | Sales | Avg. Price | New Listings | Months of Supply |
|---|---|---|---|---|
| Kitchener | 281 | $670,127 | 681 | 4.4 |
| Waterloo | 131 | $767,273 | 276 | 4.4 |
| Cambridge | 174 | $710,519 | 318 | 3.6 |
Cambridge was the strongest city by annual sales growth, up 15.2% in June, while Kitchener sales fell 12.2% and Waterloo declined 13.2%. Kitchener also posted the largest average-price decline, at 10.6%. For buyers, Kitchener generally offers the broadest selection across price points, Waterloo carries a premium tied to location and institutional employment, and Cambridge offers a lower-cost alternative for those wanting more space. Investors should focus on rent assumptions, vacancy, condo fees and resale liquidity rather than a general tech-sector narrative.
| Housing Type | Sales | Avg. Price | Annual Price Change |
|---|---|---|---|
| Detached | 2,789 | $1,291,690 | -4.6% |
| Semi-detached | 557 | $1,122,326 | -6.7% |
| Townhouse | 557 | $964,922 | -1.5% |
| Condo apartment | 1,564 | $636,323 | -5.0% |
Townhouses were the most price-resilient category, down just 1.5% year-over-year. Semi-detached homes saw the sharpest decline at 6.7%, while detached homes and condo apartments fell 4.6% and 5.0% respectively.
Cornerstone notes that average prices can swing with transaction mix, and that HPI measures are generally more useful for tracking typical home values over time.
TRREB's July market material named borrowing costs, inflation, tariffs, economic growth and employment as the major confidence factors this month. The Bank of Canada overnight rate stood at 2.3%, with the prime rate at 4.5%.
In practice, financing remains central to affordability — a small change in qualification capacity can materially shift the price range available to a purchaser, particularly in Toronto, Oakville, Vaughan and detached-home markets. TRREB also flagged municipal roadblocks, restrictive zoning, outdated rules, taxes, fees and approval delays as ongoing constraints on attainable supply.
The available data does not quantify the effect of immigration trends or broader geopolitical events on July housing activity. Geopolitical and economic uncertainty can influence buyer confidence generally, but July's numbers directly support clearer conclusions about listings, sales, prices, financing and municipal supply constraints specifically.
Buyer confidence improved enough to support seasonally adjusted sales growth from June, but many households remained cautious. TRREB specifically noted that prospective purchasers were waiting for greater clarity on tariffs, inflation, borrowing costs and the broader economy.
Seller behaviour mattered just as much: fewer owners appear willing to list into a market below previous peak expectations, which helps explain the 17.8% annual drop in new listings. If buyers stay active while sellers keep holding back, competition should increase heading into fall.
The most likely Q3 and fall scenario is gradual stabilization — not a rapid return to peak pricing.
July 2026 rewards local, property-specific analysis. We help buyers evaluate whether a listing is genuinely well priced by comparing recent sales, active competition, days on market, housing type and carrying costs.
For sellers, the key service is disciplined positioning — a home in Durham with 3.4 months of inventory shouldn't be marketed the same way as a luxury property in King or a condo in Mississauga. Pricing, presentation and negotiation all need to reflect the local evidence, not the headline average.
For investors, Team Home Axe can help underwrite conservatively across Mississauga, Milton, Hamilton, Kitchener, Waterloo and Cambridge — reviewing realistic rents, vacancy assumptions, taxes, insurance, financing costs, condo fees and exit liquidity.
The July 2026 Southern Ontario market isn't defined by one direction everywhere — it's a market of diverging municipalities, housing types and buyer segments. Buyers still have leverage, but declining supply means that leverage is becoming more selective. Sellers still need price discipline, but the market may be closer to stabilization than the annual price figures alone suggest.
Is Southern Ontario in a buyer's market in July 2026?
Southern Ontario is broadly balanced to buyer-leaning, although lower-inventory areas like Durham and Burlington are more competitive for well-priced homes. Look first at higher-inventory segments — parts of Peel, York, Hamilton and luxury markets in King and Oakville — for the strongest buyer opportunities.
Are Southern Ontario home prices rising or falling?
Prices remain lower year-over-year across the GTA and in the latest available Hamilton-Burlington and Waterloo Region data. The data does not yet establish a broad price rebound — it shows annual declines alongside tighter supply and a slight month-over-month improvement in the seasonally adjusted HPI, which supports a stabilization scenario rather than a guaranteed recovery.
Is August 2026 a good time to buy a home?
It can be, particularly for buyers with secure financing, a long holding period and a willingness to compare properties carefully. The best opportunities are likely to be property-specific rather than market-wide discounts.
Is August 2026 a good time to sell?
Sellers can benefit from reduced listing supply, but only if they price accurately. July's 32-day average marketing period and 4.6 months of inventory show that buyers remain selective.
Team Home Axe
Sharp Moves. Smart Homes.

Monthly AwardsDiamond Club: May 2025Gold Club: August 2025, April 2025....
📊 Market Report · May 2026April 2026 Southern Ontario Real Estate Market Report: What's Really Happening Across the GTA, Milton, Oakville, Mississauga, Waterloo & Hamilton
Team Home Axe | Royal Canadian Realty, Brokerage Sharp Moves · Smart HomesMilton Real Estate GuideBest Neighborhoods in Milton for Families, Commuters & First-Time BuyersBy
 Toronto Real Estate Board (TRREB); All information deemed reliable but not guaranteed. All properties are subject to prior sale, change or withdrawal. Neither listing broker(s) or information provider(s) shall be responsible for any typographical errors, misinformation, misprints and shall be held totally harmless. Listing(s) information is provided for consumer's personal, non-commercial use and may not be used for any purpose other than to identify prospective properties consumers may be interested
in purchasing. The data relating to real estate for sale on this website comes in part from the Internet Data Exchange program of the Multiple Listing Service. Real estate listings held by brokerage firms other than Royal Canadian Realty, Brokerage, Mississauga may be marked with the Internet Data Exchange logo and detailed information about those properties will include the name of the listing broker(s) when required by the MLS. Copyright ©2026 All rights reserved.
Last Updated: September 22, 2026 10:53 AM UTC
Show More...
Toronto Real Estate Board (TRREB); All information deemed reliable but not guaranteed. All properties are subject to prior sale, change or withdrawal. Neither listing broker(s) or information provider(s) shall be responsible for any typographical errors, misinformation, misprints and shall be held totally harmless. Listing(s) information is provided for consumer's personal, non-commercial use and may not be used for any purpose other than to identify prospective properties consumers may be interested
in purchasing. The data relating to real estate for sale on this website comes in part from the Internet Data Exchange program of the Multiple Listing Service. Real estate listings held by brokerage firms other than Royal Canadian Realty, Brokerage, Mississauga may be marked with the Internet Data Exchange logo and detailed information about those properties will include the name of the listing broker(s) when required by the MLS. Copyright ©2026 All rights reserved.
Last Updated: September 22, 2026 10:53 AM UTC
Show More...
 Data provided by the Ontario Regional Technology & Information Systems. The information is deemed reliable, but is not guaranteed. Not intended to solicit buyers or sellers, landlords or tenants currently under contract.
The trademarks REALTOR®, REALTORS® and the REALTOR® logo are controlled by The Canadian Real Estate Association (CREA) and identify real estate professionals who are members of CREA. The trademarks MLS®, Multiple Listing Service® and the associated logos are owned
by CREA and identify the quality of services provided by real estate professionals who are members of CREA. Used under license.
REALTOR® contact information provided to facilitate inquiries from consumers interested in Real Estate services. Please do not contact the website owner with unsolicited commercial offers.
Show More...
Data provided by the Ontario Regional Technology & Information Systems. The information is deemed reliable, but is not guaranteed. Not intended to solicit buyers or sellers, landlords or tenants currently under contract.
The trademarks REALTOR®, REALTORS® and the REALTOR® logo are controlled by The Canadian Real Estate Association (CREA) and identify real estate professionals who are members of CREA. The trademarks MLS®, Multiple Listing Service® and the associated logos are owned
by CREA and identify the quality of services provided by real estate professionals who are members of CREA. Used under license.
REALTOR® contact information provided to facilitate inquiries from consumers interested in Real Estate services. Please do not contact the website owner with unsolicited commercial offers.
Show More...
